
Watershed-Based Plan
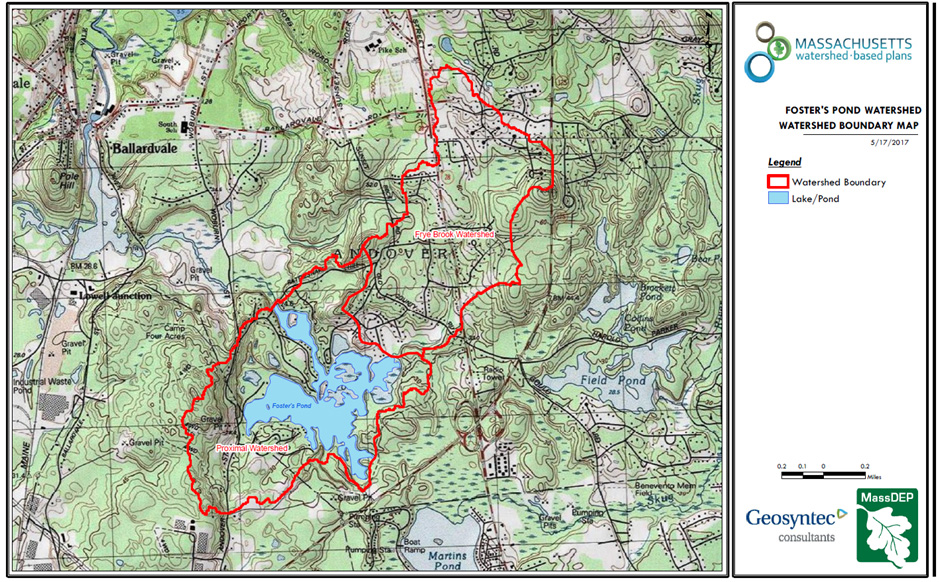
The Foster's Pond watershed occupies about 1.5 square miles. About half the watershed (northeast of the Pond) drains into Frye's Brook, which flows into the Pond near Azalea Drive. Click on the map above to open a larger image.
After treating Foster’s Pond repeatedly for toxic blue-green algae, the Corporation decided to get an answer to a persistent question: Can’t something be done to prevent algae blooms?
In 2017, the Corporation commissioned a study to find an answer. We learned that there are things we can do to lessen the problem, but there are no silver bullets. In the coming months, we’ll be rolling out more information and asking for volunteers to coordinate specific initiatives that will contribute to preserving and protecting the Pond.
The key to controlling algae is phosphorous. Phosphorous is an essential nutrient for most plants, including algae. It is also a “limiting nutrient,” about the only one that is practical to reduce to the point where algae growth can be affected. If its availability in a water body can be lowered, algae blooms can be controlled.
We’ve known for years that Foster’s Pond develops, over the course of a summer, too much phosphorous in the water - enough to stimulate algae growth. But where does it come from? Until recently, there was no economical way to find out.

This map depicts land uses in the Foster's Pond watershed. The two largest contributions to phosphorous loading come from forested areas and low-density residential neighborhoods. Click on the map above to open a larger image.
In the past, detailed sampling of every possible source, from septic systems to intermittent streams, would have been required, and the costs would have been astronomical. Even worse, the experts who proposed such studies said they could probably not reach useful conclusions and were likely to tell us, after we spent tens of thousands of dollars collecting data, that they would need to conduct further studies.
In 2017, however, a new tool became available. The State commissioned Geosyntec Consultants, a world-wide environmental consulting firm, to develop a computer model that can use data pertaining to any watershed to estimate phosphorous loading from a variety of sources. We hired Geosyntec to apply the model to Foster’s Pond.
The result is our very own “Watershed-Based Plan” (or WBP) that provides us hard numbers on how much phosphorous is coming into the Pond each year, where it’s coming from, how much we need to target to see a reduction in algae, and what are the most cost-effective targets.
Geosyntec looked at the entire Foster’s Pond watershed, an area of 957 acres or 1.5 square miles, where surface water flows directly into the Pond or flows into streams or intermittent tributaries that find their way to the Pond. A little less than half of the Pond’s watershed consists of a “sub-watershed” draining into the Pond through Frye’s Brook, which flows under County Road and enters the Pond at the Old Mill Reservoir, between Azalea Drive and the Goldsmith Woodlands.
Using both data from the model and information specific to Foster’s Pond, Geosyntec was able to estimate that 255 pounds of phosphorous is entering the Pond each year. If we could reduce that amount by 10%, just 25 pounds per year, our algae problem would be significantly reduced.
That’s a reasonable goal. But it’s easier said than done.
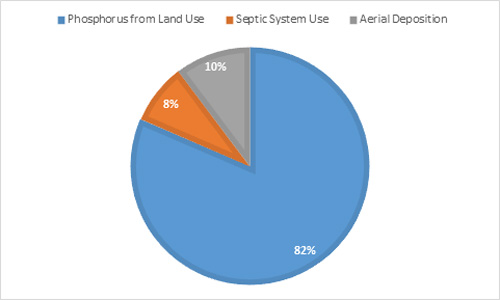
Of the 255 pounds of phosphorous entering the Pond each year, relatively little comes from rain falling directly into the Pond or from nearby septic systems. Most is carried in from stormwater run-off.
To cut phosphorous flowing into the Pond, we need to understand where it’s coming from. Of the 255 pounds, 26 pounds fall from the sky, raining directly into the Pond from storms. A mere 21 pounds seep into the Pond from the 74 homes - 67 in Andover and 7 in Wilmington - that have septic systems within 200 feet of the Pond.
The remaining 208 pounds per year come from stormwater run-off, washing phosphorous from land in the watershed into streams and gullies that lead to the Pond.
The biggest single contributor is not, however, what you might think. Forested areas - like the Goldsmith Woodlands and the Wilkinson Reservation - contribute 88 pounds (42%) of the watershed’s land-based phosphorous loading. The phosphorous comes from natural processes, like the decomposition of leaf litter and fallen trees.
The next biggest contributor, however, is less surprising: low-density residential areas (read: big lawns) throughout the watershed, especially in the Frye’s Brook subwatershed. Low-density residential land use contributes an estimated 72 pounds of phosphorous per year. The Frye’s Brook subwatershed, even though comprising less than half the entire watershed, contributes about 60% of the land-use based phosphorous loading to Foster’s Pond.
So how do we reduce the phosphorous flow? We aren’t about to cut down the forests, and we can’t stop the rain. We can remind near-by residents who rely on septic systems to use only phosphate free cleaning products, but that's a relatively small part of the problem.
To make a real difference, other approaches are needed. The WBP suggests several. Some are for individuals. Others will take volunteers to organize a coordinated effort.
For individuals, here’s a handy checklist:
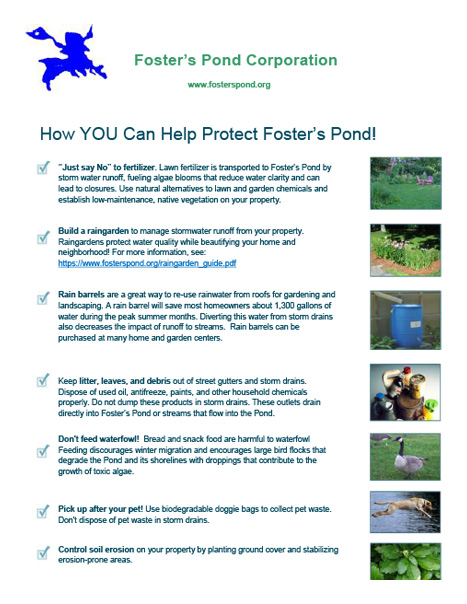
Here is a list of things you can do to protect the Pond. Remember, if you live in the Foster's Pond watershed, your actions can affect the health of the Pond. Click on the image to open a printable pdf version.
For efforts that will require the coordinated work of volunteers, the WBP offers a menu of possibilities:
- The plan has a list of specific projects to manage stormwater drainage so that phosphorous is captured before it flows into the Pond. These projects are relatively expensive, but would qualify for State matching grants.
- The plan suggests a program of working with the Towns of Andover and Wilmington to increase the cleaning of catchbasins in the watershed, which can reduce phosphorous loading.
- Additionally, the plan suggests working with the Towns to locate and examine outfalls from catchment areas (particularly in Wilmington, along Andover Street) to evaluate their adequacy for reducing stormwater flows into the Pond and its tributaries.
- Working with the Towns to enhance street sweeping in spring and summer months could remove significant quantities of organic debris that contributes to nutrients in the Pond.
- The plan suggests initiating a program to promote raingardens (particularly on roads with direct stormwater drainage to the Pond, such as Foster’s Pond Rd., Pomeroy Rd., Snowberry Rd., Azalea Dr., and Morningside Dr.). By capturing and “pre-treating” run-off, a raingarden can reduce phosphorous loading.
- The plan recommends initiating a program to reduce the use of fertilizers containing phosphorous throughout the watershed. Landscaping can be a significant phosphorous source wherever lawns are maintained (office parks, schools, sports fields, and residences). Although Massachusetts law now prohibits using fertilizers containing phosphorous for routine lawn maintenance (and requires retailers to post signs if they sell fertilizers containing phosphorous), most people are unaware of the law, and many retailers fail to post the required signs. A program could educate homeowners, businesses and appropriate Town departments about the requirements, and provide signs to retailers.
- Expand the Corporation’s phosphorous monitoring. Currently, the Corporation tests water samples for phosphorous once a year. The WBP suggests a more robust program of in-lake phosphorous monitoring that would provide significantly more data about the health of the Pond and the effectiveness of phosphorous-reduction programs. Such a program would be quite expensive if performed by consultants. Volunteers, however, could work on enlisting assistance from a school or college that is interested in field study opportunities for students enrolled in environmental programs.
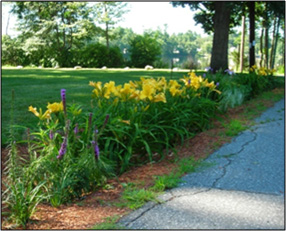 |
| This roadside raingarden in Wilmington captures stormwater run-off that would otherwise flow into a nearby pond. |

 Questions? Comments? Contact us at